Exploring Chaos with Futhark: The Feigenbaum Project
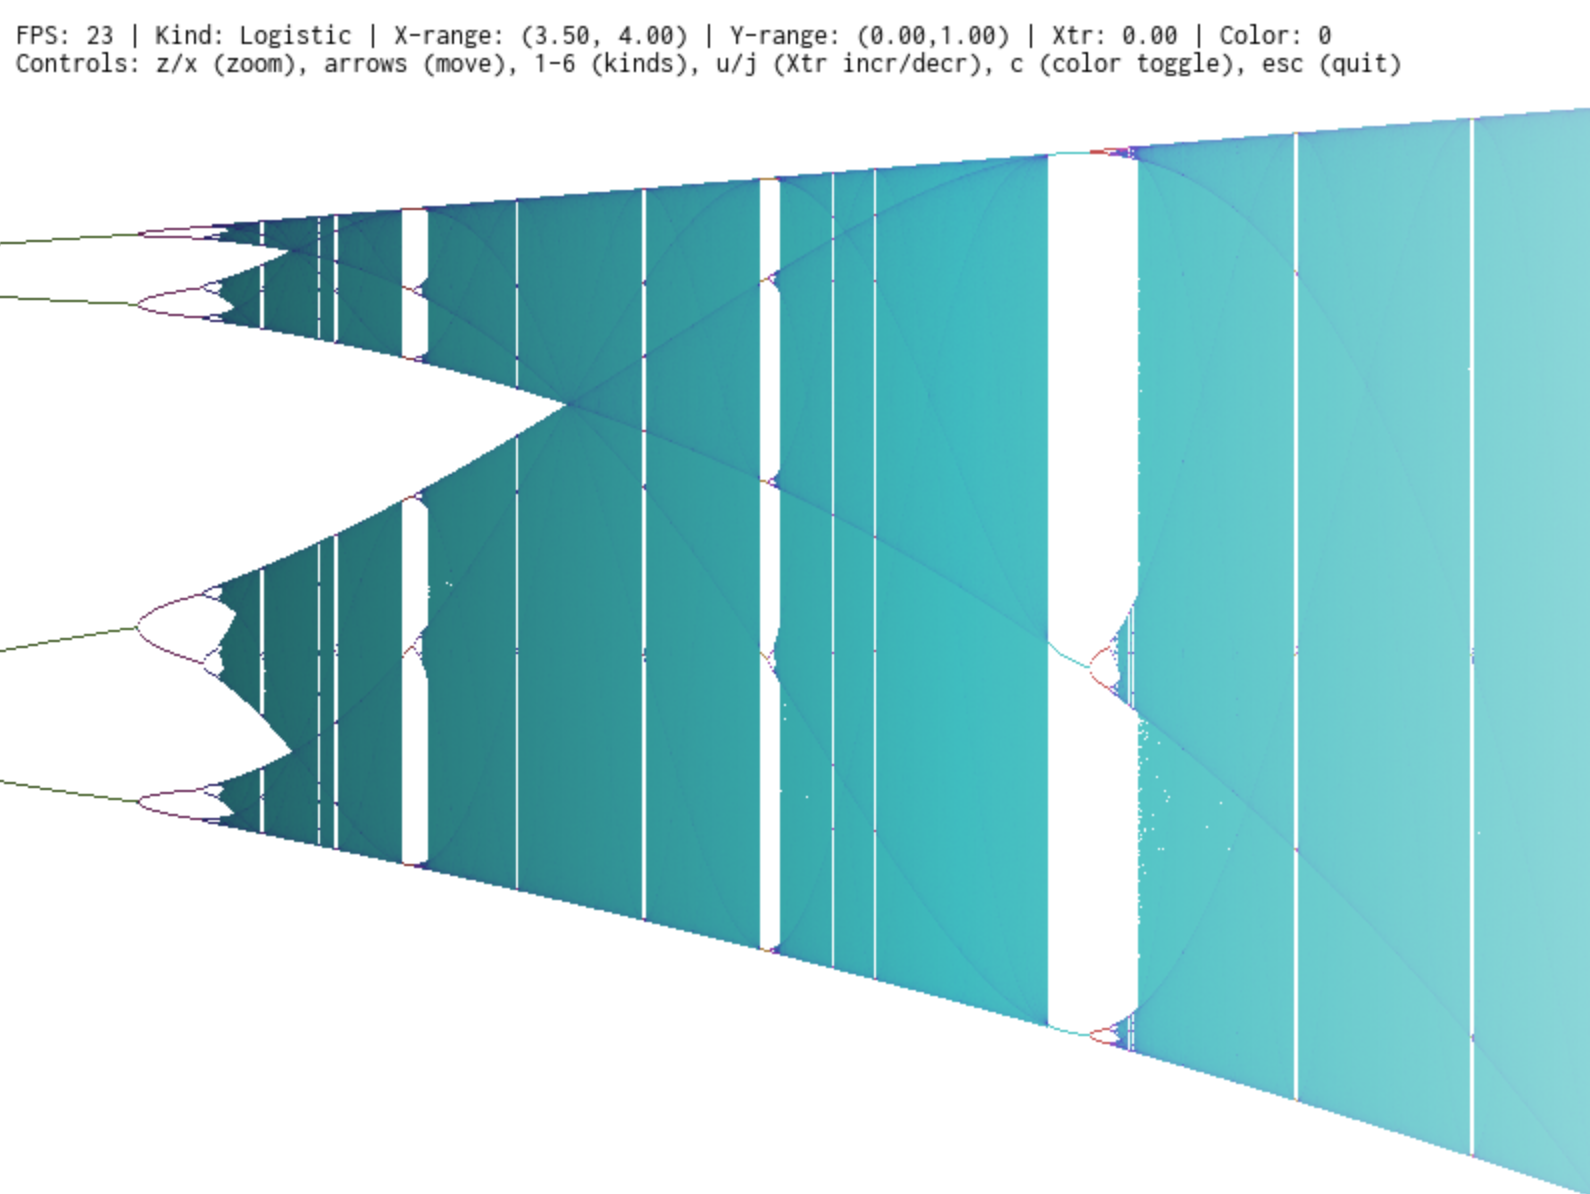
My feigenbaum project uses Futhark
to explore how simple repeated calculations can produce surprisingly intricate
patterns. The application draws bifurcation diagrams: each horizontal position
selects a parameter, and the points above it show values reached after letting
the calculation settle. The familiar logistic map, x → r × x × (1 − x),
reveals branches splitting into finer patterns as its parameter changes.
Built on the Futhark Lys library, the viewer lets you pan, zoom, and switch between several recurrence equations while exploring their behaviour.
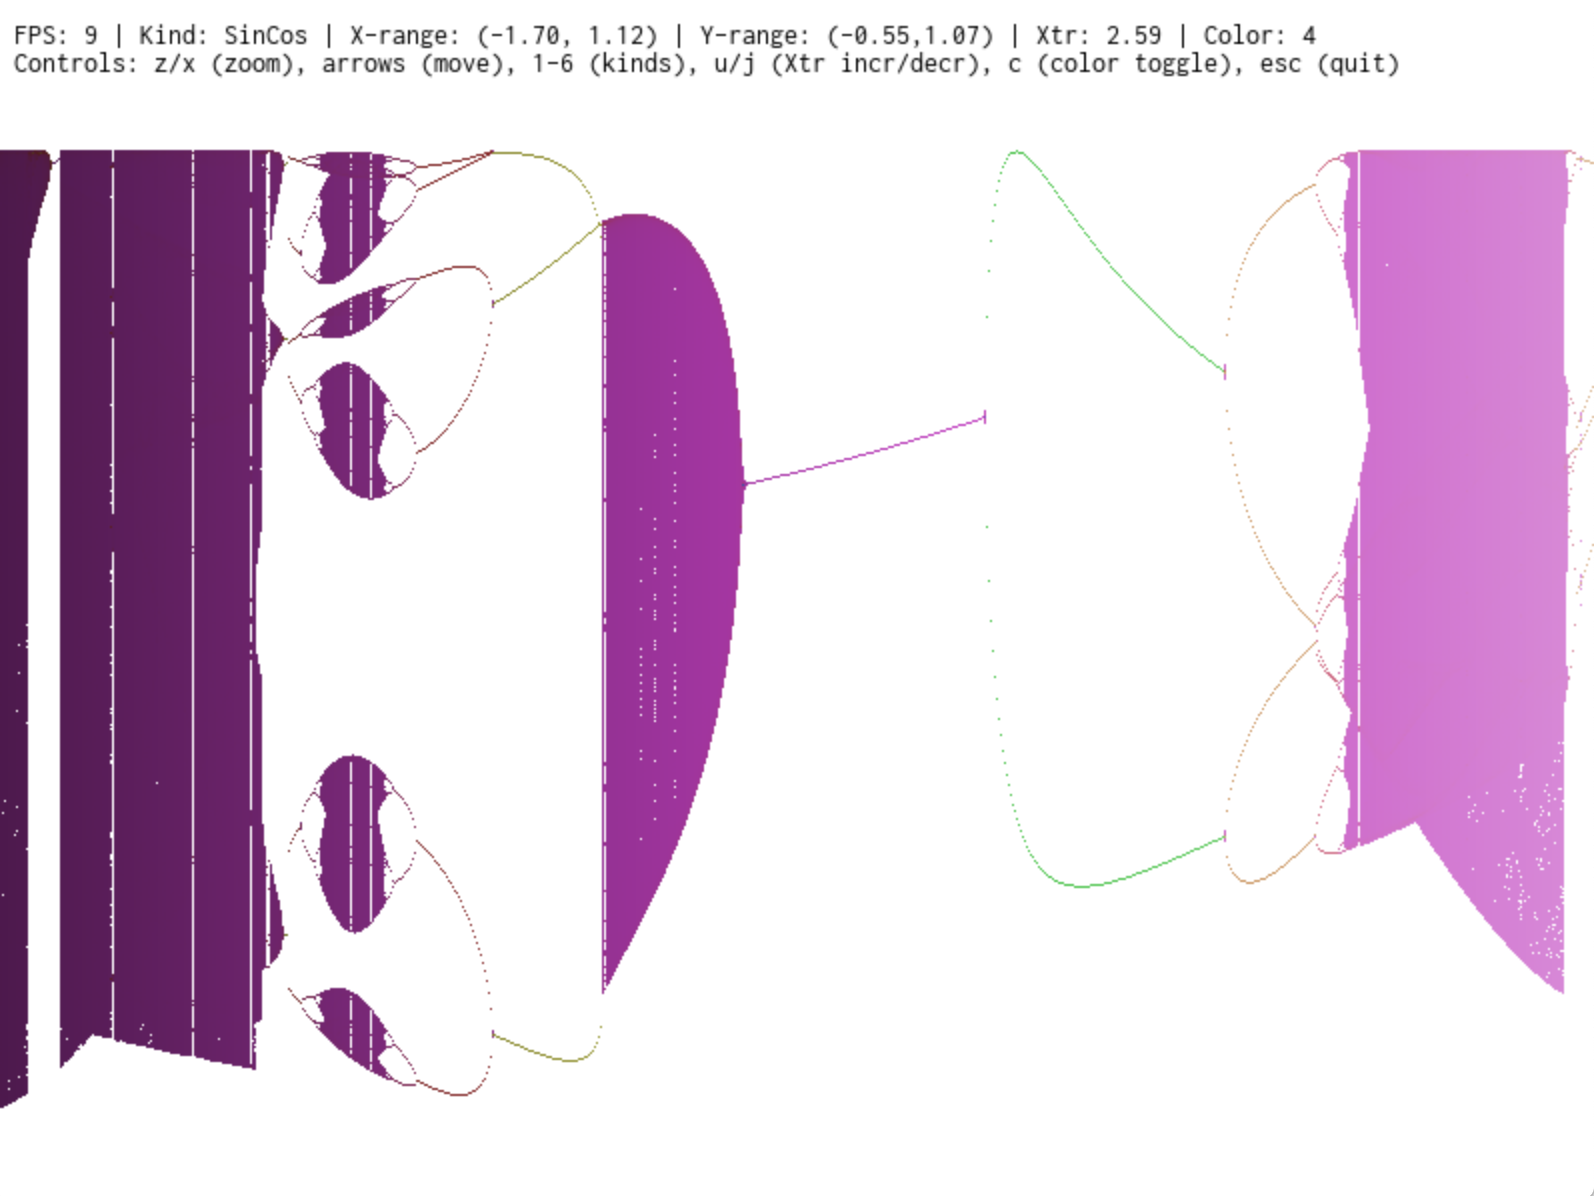
The SinCos map combines sine and cosine in a two-variable recurrence, producing a different collection of bands and branches. The viewer also includes the tent and Gaussian maps. Comparing these pictures is a hands-on way to explore how changing a parameter can lead from regular oscillations to chaotic behaviour.
Futhark computes the diagram’s columns in parallel. Each column first runs some warm-up iterations, then records further values for drawing. The steps within one recurrence depend on each other, but different parameter values can be explored independently.
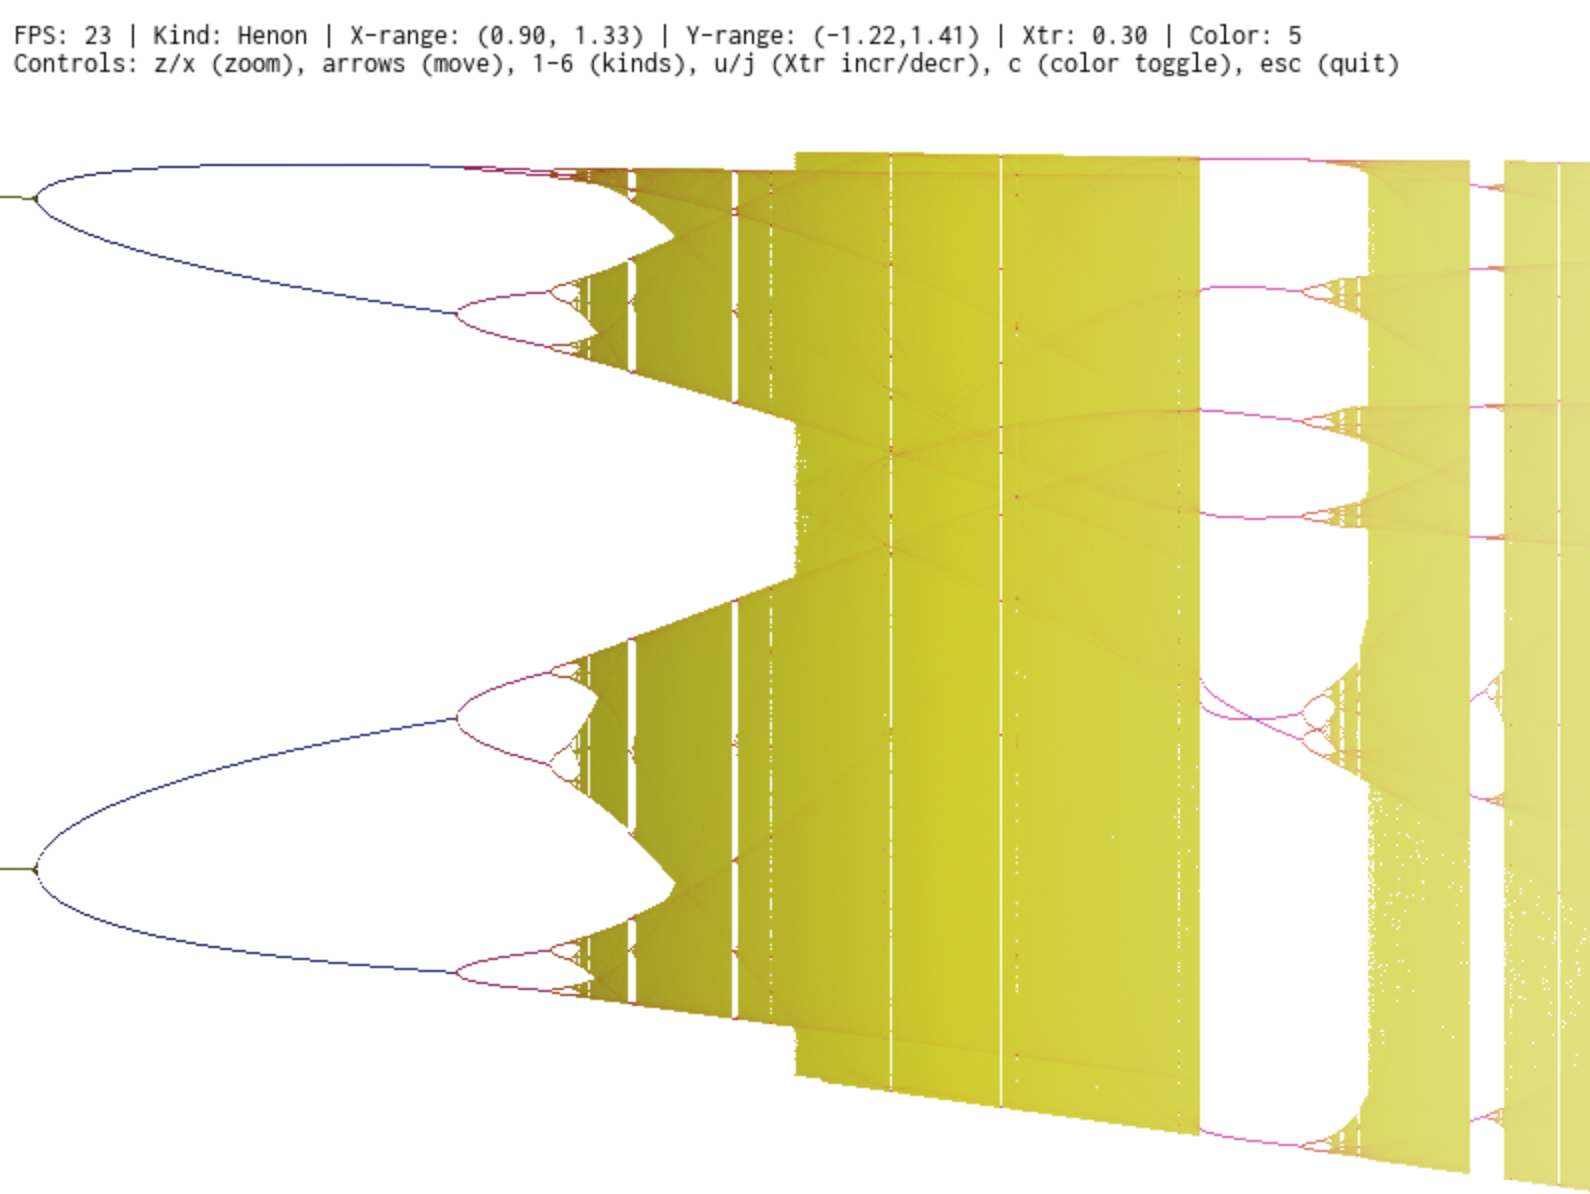
The Hénon map provides another two-variable example to investigate. The repository also includes an interpreted version of the logistic map: a small interpreter written in Futhark executes a sequence of instructions representing the formula. This explores how the same compiled program could support different recurrence formulas supplied at runtime.
The repository contains the source,
build instructions, and examples of how to add another recurrence. Use the
arrow keys to navigate, z and x to zoom, and 1–6 to switch examples.
All three images shown here come from the project; click one to see it at
full size.